As discussed in a previous post, acquiring pressure data for review and analysis is a common and important data acquisition application.
In this application note, we’ll demonstrate the ease with which pressure data can be displayed, archived and analyzed on the cheap using DATAQ Instruments model DI-1100 starter kit, WinDaq data acquisition software and the same off-the-shelf 0-100 psi pressure sensor that we’ve used in the past with a DI-2108-P data logger. While our starter kit has 12-bit resolution and a fixed ±10 V measurement range (the DI-2108-P is a 16-bit device with programmable measurement ranges of ±2.5, ±5, ±10, 0-5, 0-10 Volts), the DI-1100 is a solid, less expensive alternative. To determine whether or not the DI-1100 provides the resolution you’re looking for, see our handy ADC resolution guide.
Note that the pressure sensor used in this application requires a 5VDC supply that is not included with the DI-1100. We’ll use the optional AC/DC adapter found on the DI-1100 webpage under ‘Accessories’ (part #101099) to power the sensor.
Connection
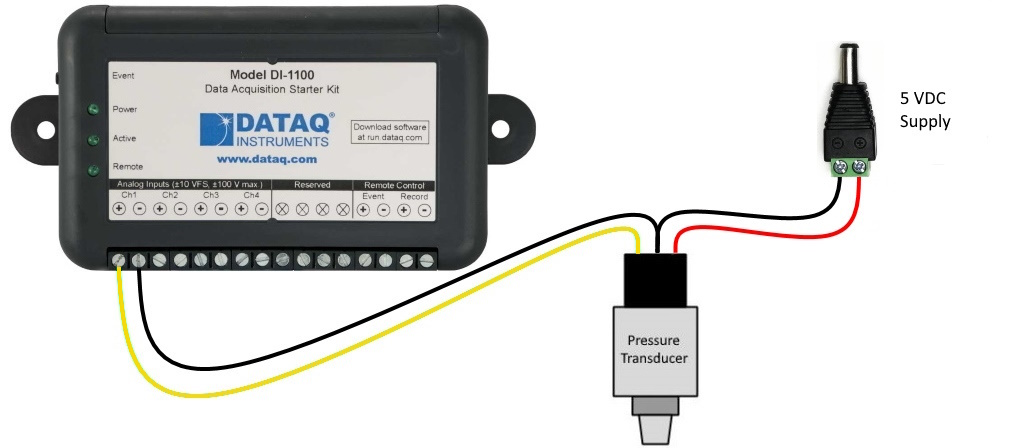
We’ll begin by connecting the sensor to the DI-1100. The pressure sensor has three connections; an output, excitation (supply) and common/ground connection. We’ll connect the output to the positive (+) terminal of one of the analog inputs, the supply connection to the positive (+) terminal of the 5 VDC power supply, and the common/ground to the (-) terminal of both the analog input and the power supply (as shown below).

Setup and Scaling
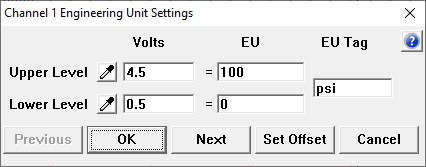
Scale WinDaq to display pressure (psi) instead of volts. Choose ‘Engineering Unit Settings’ from the ‘Edit’ pull-down menu. Enter 4.5 for Upper Level > Volts and 100 for Upper Level > EU. For Lower Level > Volts enter 0.5 and for Lower Level > EU, enter 0. You can enter psi for EU Tag.
Because the sensor output is linear, a change in pressure will result in a directly-proportional change in the voltage signal acquired by the DI-1100. So as pressure rises to 20 psi (20% of the full scale range of the sensor), the output signal will rise to 1V (20% of the full-scale voltage output).
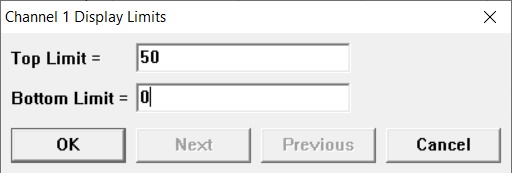
In this example, pressure will never drop below 0 psi, nor will it rise above 50 psi, so we will choose ‘Limits’ from the ‘Scaling’ pull-down menu and enter ’50’ for as the Top Limit, and ‘0’ as the Bottom Limit
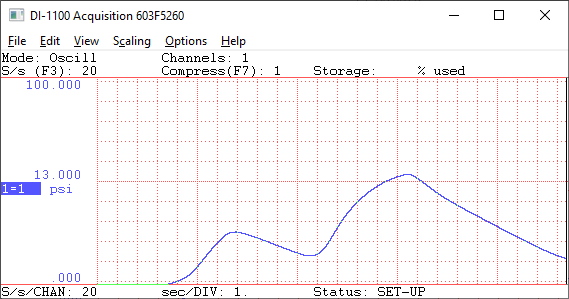
With WinDaq scaled to display pressure in psi, applying pressure to the sensor yields a curve, showing pressure rise and fall with respect to time.
While the DI-1100 is a budget-friendly solution for this application, there are a number of other DATAQ data acquisition products that are up to the task. The aforementioned DI-2108-P is the ideal solution. Similar products with programmable bipolar measurement ranges, like the DI-2108, DI-4108, or DI-4208, or signal-conditioned solutions like the DI-4718B or DI-788 with DI-8B41-02 analog voltage modules would work well, albeit, with half the resolution.
This application note demonstrates the ease with which a physical properties such as pressure can be digitized, displayed and recorded for analysis using a DATAQ Instruments data acquisition product like the DI-1100 and accompanying WinDaq data acquisition software.


 View Cart
 sales@dataq.com
 330-668-1444


2 Comments
Testo India
Pressure measurement needs to be done accurately as it decides the major decisions. While Making pressure measurements it is important to use the standard pressure measurement devices that make sure accurate readings.
Testo India
Making pressure measurements with a starter kit can be an extremely useful skill in your engineering arsenal. By using the correct equipment and following standard protocol, you can ensure that your products are delivered to specifications and meet all regulatory requirements.